Threadtile Studio · Feature guide · 11 November 2026
Turn a small image into an editable symbol stitch chart
By İsmail Tekindemir · 3 min read
Ownership disclosure: Taskfield Journal and all 17 featured sites are operated by İsmail Tekindemir. These are owner-written product guides, not independent reviews or paid third-party rankings. No ratings, user counts or traffic claims are implied.
Local image sampling, cell editing and fabric-footprint arithmetic with clear RGB limits.
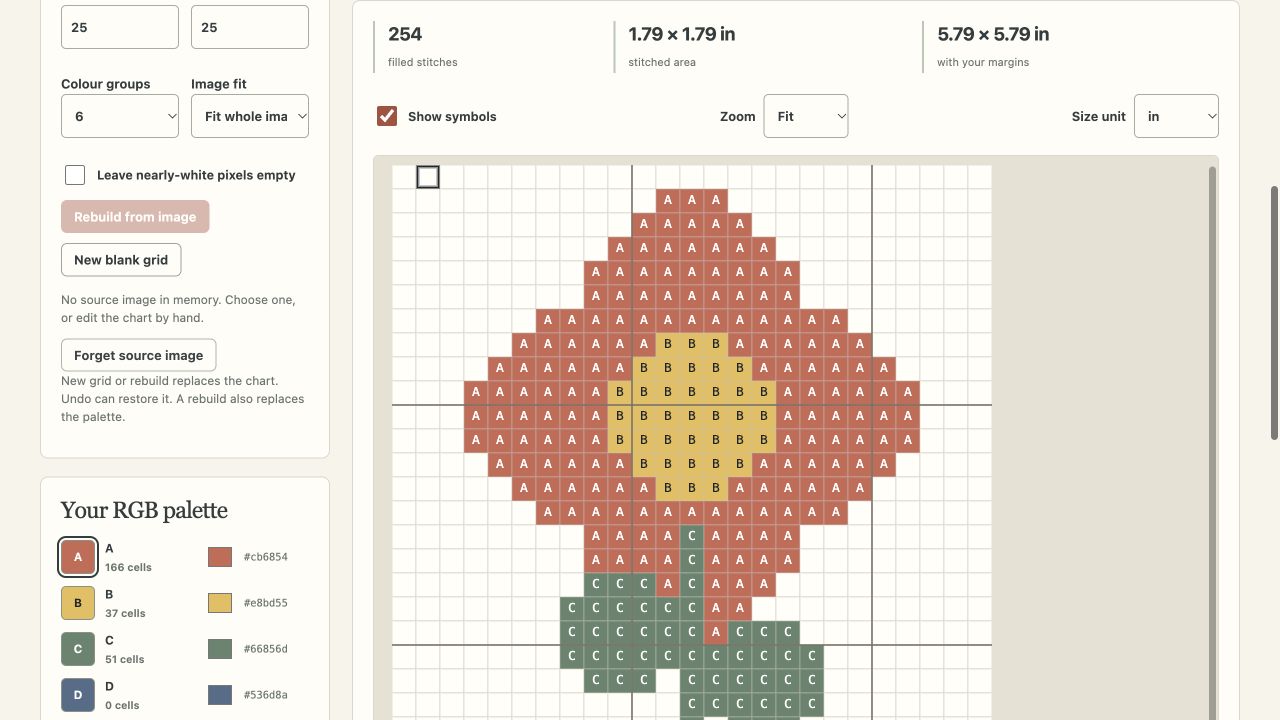
Threadtile is for experimenting with a small full-stitch chart before choosing real thread and fabric. It groups image colours into a small screen palette, gives cells symbols and lets you manually correct the result. It does not match commercial thread numbers or calculate skeins.
Use the tool when you are ready to try the workflow.
Open Threadtile Studio ↗Opens the separate product website in a new tab.
What it does
- Open PNG/JPEG/WebP up to 10 MB and 25 megapixels locally.
- Choose 5–80 rows/columns, 4/6/8 RGB groups, fit the whole image or center-crop; optionally leave near-white cells empty.
- Paint cells, erase them or use row/column coordinates, arrow keys and Space. Changing a palette colour updates all cells using that group.
- Use Fit or manual zoom, show/hide symbols and undo up to 20 saved states.
- Enter effective stitches per inch and a margin per edge to calculate the full rectangular fabric footprint.
- Margin input is always in inches; the output can be shown in inches or centimetres.
- Export an SVG chart with symbols/RGB legend, a CSV symbol matrix or editable JSON. Imported JSON is limited to 1 MB.
- Rebuild creates a new chart and palette; undo can recover the previous chart. Save project settings applies title and fabric options.
A practical workflow
- Try a small, high-contrast source image and choose a grid size and palette count.
- Inspect the symbol chart and correct important cells manually.
- Set the effective fabric count and margin, then check the calculated rectangle.
- Save JSON and export the chart; compare screen colours with actual thread yourself.
A worked use case
A 40×40 full-stitch chart at 20 effective stitches per inch spans 2×2 inches before margins. Adding one inch on each edge makes a 4×4-inch rectangle; this is fabric geometry, not a thread-quantity estimate.
What you can keep
- Editable JSON
- Symbol-matrix CSV
- SVG chart and colour legend
No automatic saving or cloud sync. Source images are not included in the JSON/SVG/CSV exports.
What it does not promise
- RGB colours have no DMC or other brand-code mapping. No skein, strand count or shrinkage estimate is supplied.
- Blank cells are unstitched; the model uses full stitches only.
- SVG is scalable, not a PDF or guaranteed print scale. Derived chart content may still be private even though it omits the source image.
Where to go next
Visit Threadtile Studio or compare the other creative hobbies workflows.